Seasonal Variations in Participation Rates for Virtual Reward Events Tied to Holiday Cycles
Written by Morgan Jung · Aug 8, 2026
Seasonal Variations in Participation Rates for Virtual Reward Events Tied to Holiday Cycles
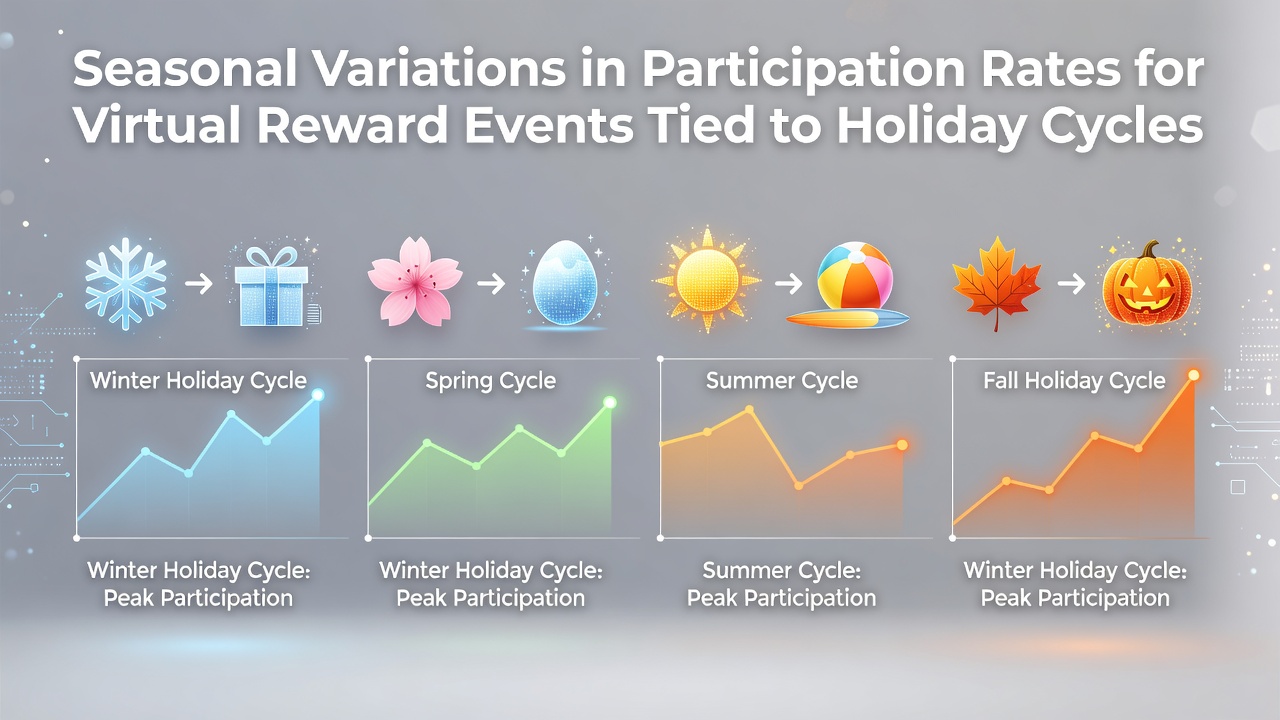
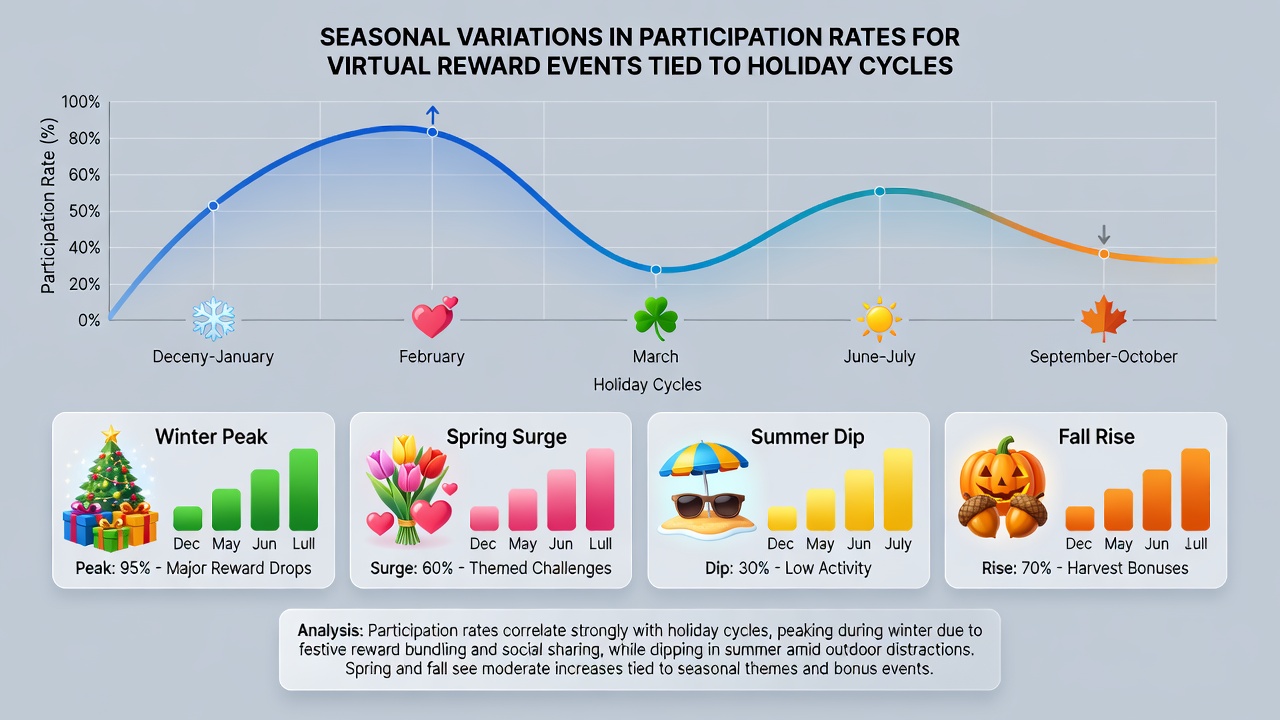
Participation rates in virtual reward events fluctuate in clear patterns that align with major holiday cycles, according to aggregated platform analytics from multiple operators. These shifts reflect changes in user availability, spending behavior, and promotional activity that intensify around festive periods while tapering during quieter months. Data collected across North American and European systems show consistent peaks during November through January, with secondary surges tied to summer holidays and back-to-school promotions.
Patterns Around Major Winter Holidays
Entry volumes for digital prize drawings rise sharply in the weeks leading into Christmas and New Year, driven by increased leisure time and heightened consumer engagement with online promotions. Platform records indicate that submission rates can climb 40 to 60 percent above baseline during December compared with October figures in the same regions. Those who track these metrics note that the influx coincides with family gatherings and extended breaks, when participants have more opportunity to complete multi-step entry forms. Research from industry reports highlights how retailers and reward organizers time campaigns to capitalize on gift-seeking behavior, which in turn boosts overall activity in chance-based reward pools.
January often sustains elevated levels because many users redeem gift cards or new devices acquired during the holidays, creating a secondary wave of activity. Observers have documented slower declines through February, whereas March tends to mark a return toward average participation as routines normalize after winter breaks.
Summer and Transitional Periods
Summer months introduce different dynamics, with participation influenced by vacations and outdoor activities that compete for attention. July sees moderate upticks around Independence Day promotions in the United States and similar national celebrations elsewhere, yet overall engagement remains lower than winter peaks because many users spend less time on mobile devices during travel. August 2026 is expected to follow the same trajectory, with back-to-school campaigns launching in late July and early August to capture families preparing for the new academic year. These promotions often feature school-supply giveaways and tech bundles, which data from previous cycles show can lift entry counts by 25 to 35 percent over June baselines in comparable markets.
September and October typically register steadier but unspectacular volumes, punctuated by smaller holiday events such as Halloween-themed contests that generate brief localized spikes. Analysts tracking cross-border access note that regional differences become more pronounced during these shoulder months, as school calendars and weather patterns vary widely between hemispheres.
Factors Driving the Variations
Several measurable elements contribute to these seasonal swings. Increased disposable income around bonus payouts and tax refunds in early-year months correlates with higher willingness to engage in reward events that require purchases or extended interaction. Leisure time availability also plays a direct role: platform telemetry reveals longer session durations during holiday weeks, which translates into more completed entries per user. Promotional calendars from brands and retailers further amplify these effects by concentrating campaigns around culturally significant dates.
Regulatory frameworks in different jurisdictions add another layer of influence. Guidelines from the Australian Competition and Consumer Commission emphasize clear disclosure of promotion terms, which can affect how operators schedule campaigns in that market and, by extension, participation timing. Similar oversight from Canadian provincial bodies shapes cross-border eligibility rules that participants must navigate during peak seasons. Academic studies from European universities have examined how notification timing interacts with these holiday windows, finding that messages sent two to three days before major entry deadlines achieve higher response rates than those distributed earlier.
Regional and Platform-Specific Observations
North American platforms consistently report stronger December surges than their counterparts in Asia-Pacific regions, where Lunar New Year celebrations generate comparable activity in January or February depending on the calendar. European systems show additional lifts around Easter and national holidays that do not align with North American schedules, creating staggered global patterns. Mobile app data further indicate that device usage patterns shift during holidays, with evening and weekend submissions rising as users incorporate reward activities into downtime.
Those monitoring long-term trends note that the introduction of new reward formats, such as augmented reality filters or community challenges, can temporarily alter these established cycles, yet the underlying holiday alignment tends to reassert itself within two to three seasons. Aggregated figures from trade associations covering promotional marketing confirm that total annual entries remain relatively stable year over year, with the distribution across months shifting in predictable ways tied to cultural calendars.
Conclusion
Seasonal variations in participation for virtual reward events follow predictable rhythms anchored to holiday cycles across multiple regions and platforms. Winter months deliver the largest sustained increases, summer periods show moderate holiday-driven lifts, and shoulder seasons maintain baseline activity punctuated by smaller themed promotions. These patterns emerge from combined effects of leisure availability, promotional timing, and regulatory environments that shape access and engagement. Continued monitoring of entry data through 2026 and beyond will clarify whether evolving device capabilities or new campaign structures modify these long-standing seasonal distributions.