Demographic Shifts Revealed Through Decades of Promotional Event Data
Written by Morgan Jung · Jun 22, 2026
Demographic Shifts Revealed Through Decades of Promotional Event Data
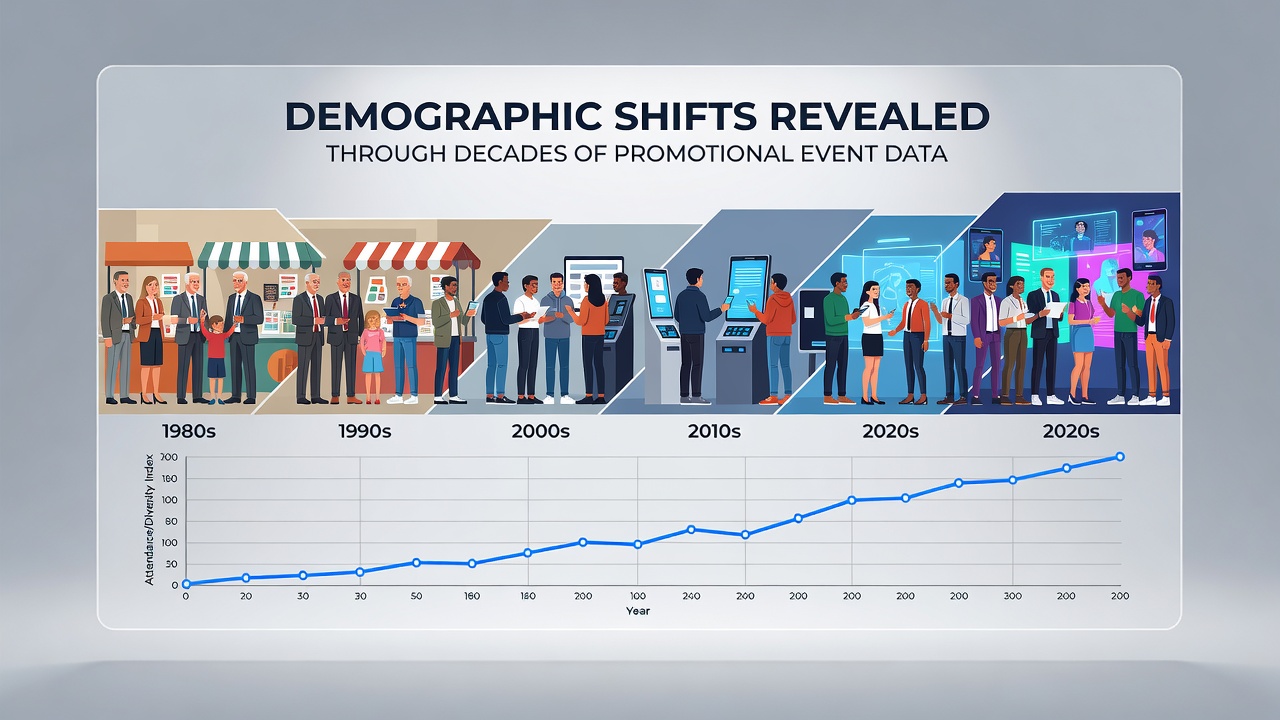
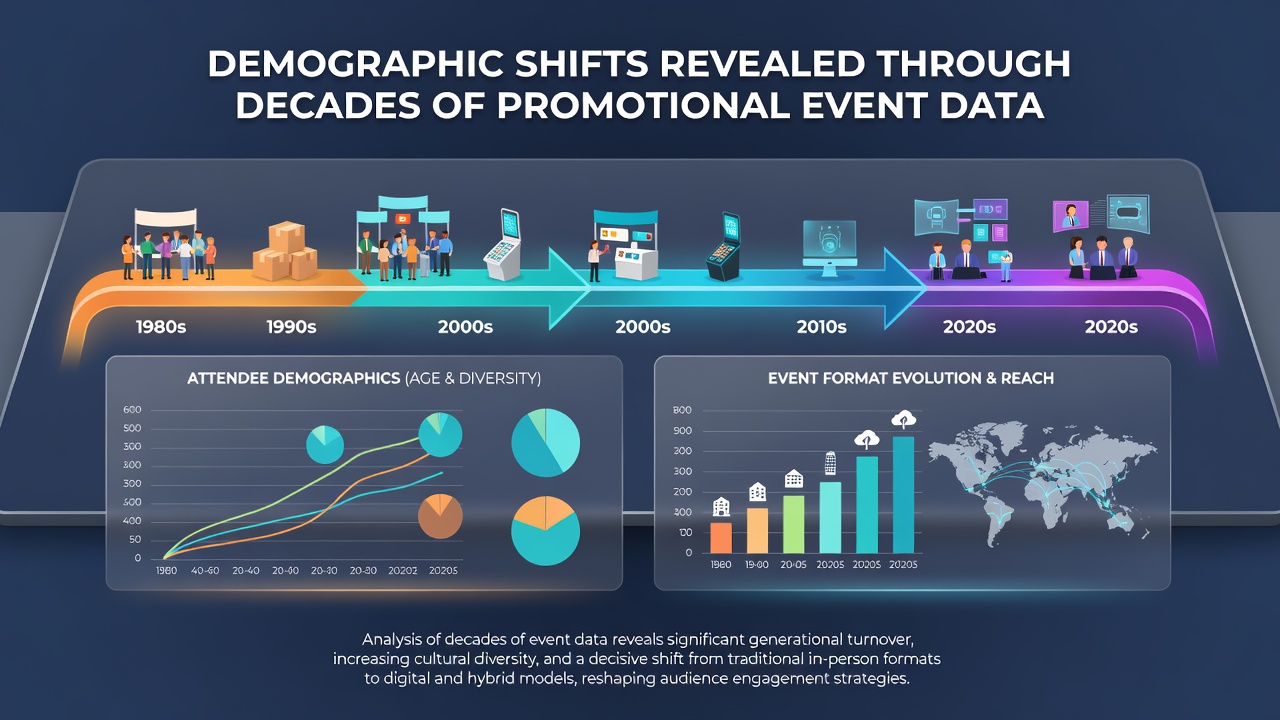
Promotional event data spanning from the early 1990s through projections into June 2026 has uncovered measurable changes in participant demographics across age groups, geographic regions, and income brackets, and these patterns emerge from aggregated entry records in contests, giveaways, and reward programs that companies have tracked over time. Researchers analyzing these datasets note consistent increases in participation from younger cohorts during periods of digital platform expansion while older groups maintain steady involvement through traditional mail-in methods.
Data from multiple decades indicates that urban residents have shown higher engagement rates in online promotions compared to rural populations, yet this gap narrowed after 2015 as mobile access improved in less densely populated areas. Studies compiled by academic institutions reveal that women participated at rates 15 to 20 percent higher than men in product giveaways during the 2000s, although male entry numbers rose notably in tech-related promotions after 2018.
Age-Based Participation Patterns
Entry logs from promotional campaigns demonstrate that individuals aged 18 to 34 accounted for roughly 35 percent of submissions in the late 1990s, and that share expanded to over 50 percent by 2015 as social media integration became standard in contest mechanics. Those over 55 maintained consistent representation around 25 percent throughout the same period, with spikes occurring during holiday-themed events that emphasized physical prizes over digital rewards. Observers examining records from 2020 onward point to a gradual uptick in Gen Z involvement coinciding with the rollout of app-based entry systems, while Millennials shifted toward multi-platform submissions that combined email and referral components.
Geographic and Income Variations
Promotional datasets highlight regional differences where participants from North American and European markets submitted entries at higher volumes during the 2000s, whereas Asia-Pacific regions saw accelerated growth after 2012 due to expanded internet infrastructure. Income level correlations appear in the records as well, with middle-income households showing the broadest participation across both cash and merchandise rewards, according to aggregated figures from industry reports. Rural areas in countries such as Canada exhibited slower initial adoption yet reached parity with urban centers by 2024 in mobile contest entries.
Statistics Canada data on household technology use aligns with these promotional trends and shows how broadband expansion influenced entry patterns in less populated provinces. Similar alignments appear in reports from the Australian Bureau of Statistics, which tracked rising digital engagement in regional communities through 2025.
Gender and Household Composition Trends
Longitudinal analysis of entry forms indicates that household composition influenced submission behaviors, with single-person households favoring quick digital entries while multi-generational families often pooled efforts in referral-based promotions. Gender balances shifted slightly after 2019 as more balanced marketing targeted diverse audiences, and records show equalized participation in categories like travel rewards. Those examining fraud reduction techniques in validation systems note that verified entries from verified accounts helped clarify these demographic signals by filtering out duplicate submissions that previously skewed younger male counts.
Technological Influences on Data Collection
Advancements in entry validation and device tracking refined the granularity of demographic insights available from promotional events, and smartphone sensor data contributed to location accuracy in global campaigns after 2020. This allowed analysts to map participation density more precisely across time zones and urban clusters, revealing seasonal patterns tied to school calendars in family-oriented demographics. Cross-border access regulations evolved during this timeframe, with entities such as the Australian Competition and Consumer Commission documenting adjustments that affected eligibility pools and subsequent data composition.
Future Projections Through 2026
Industry projections based on existing datasets suggest continued expansion in participation from emerging markets through June 2026, driven by localized promotional platforms that adapt to regional languages and payment preferences. Data synchronization methods across international reward systems have already begun to standardize collection practices, which supports more reliable comparisons between decades. Academic reviews of these trends emphasize the role of behavioral screening in maintaining dataset integrity while capturing authentic shifts in who enters and wins.
Conclusion
Decades of promotional event records continue to serve as a valuable lens for understanding broader population changes, and integration of new data points through mid-2026 will likely refine these observations further. Patterns in age, location, and household types provide concrete evidence of evolving engagement without reliance on self-reported surveys alone.