Browser Performance Metrics as Predictors of Participation Outcomes in Digital Prize Events
Written by Kai Krause · Aug 15, 2026
Browser Performance Metrics as Predictors of Participation Outcomes in Digital Prize Events
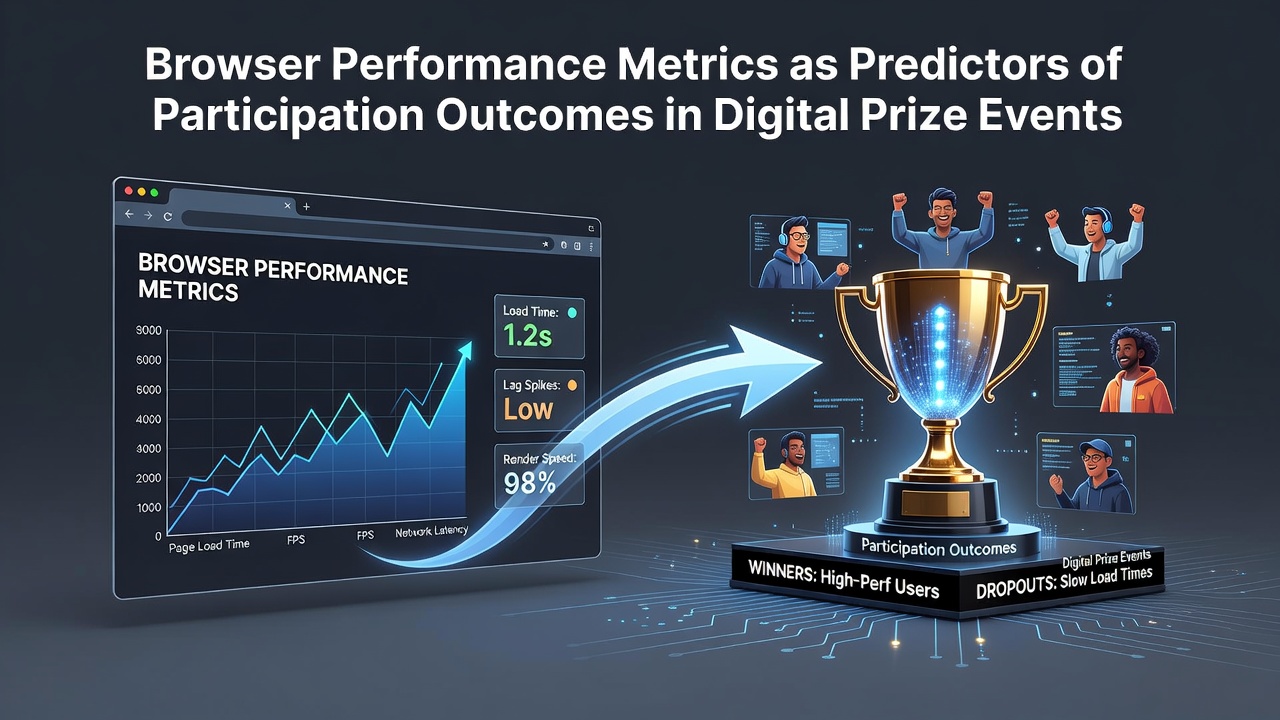
Browser performance metrics have emerged as measurable indicators that correlate with how users complete entries in digital prize events, and data from multiple tracking studies show consistent patterns across platforms. Load times, JavaScript execution efficiency, memory usage, and frame rates during page interactions all feed into models that forecast completion rates for sweepstakes, giveaways, and promotional draws. Researchers tracking these variables note that slower rendering often precedes higher abandonment before submission forms reach final confirmation stages.
Core Metrics Tracked in Prize Platforms
Time to interactive stands out as one of the strongest signals because users must navigate multi-step forms, captcha checks, and social sharing options before an entry registers successfully. Studies compiled through 2025 reveal that pages crossing the five-second threshold for time to interactive see completion drops of up to 28 percent compared with sub-three-second experiences. First contentful paint and largest contentful paint further influence early-stage decisions, since participants often scan prize details and eligibility rules within the first few seconds of arrival.
Memory consumption during extended sessions also correlates with outcomes. When browser tabs accumulate cached assets from referral loops or embedded video previews, devices with limited RAM exhibit increased lag that interrupts the final submission click. Observers monitoring mobile and desktop sessions report that heap size spikes above 150 MB frequently coincide with users closing tabs midway through verification sequences, particularly on older hardware still common in certain regions.
Data Patterns Linking Performance to Entry Success
Analytics platforms that integrate browser telemetry with entry logs have produced datasets showing direct relationships between frame rate stability and multi-entry campaigns. When scrolling through leaderboards or updating live draw counters drops below 30 FPS, repeat participants reduce their activity volume by measurable margins. This pattern holds across desktop Chrome instances and Android WebView environments where thermal throttling begins to affect sustained performance.
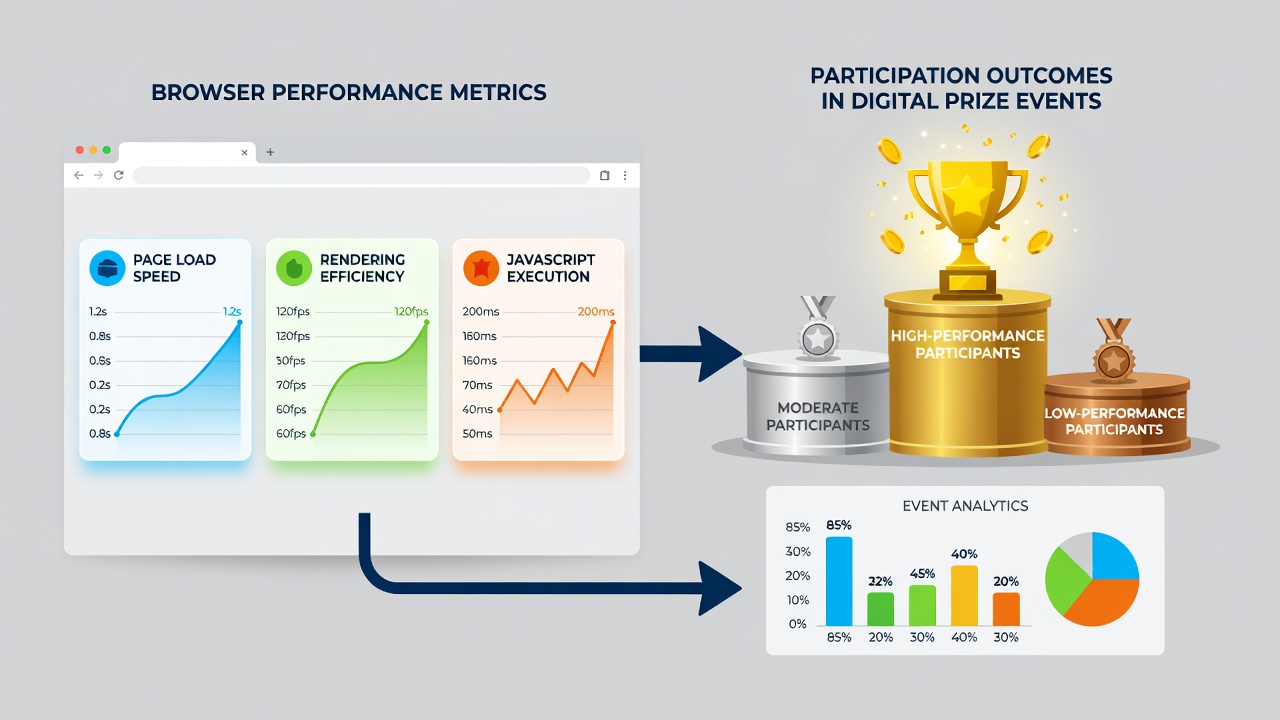
Network latency combined with client-side rendering delays creates compound effects. A study released by the University of Toronto's Human-Computer Interaction lab examined over 1.2 million sessions from North American users and found that each additional 500 milliseconds of total blocking time reduced the probability of reaching the confirmation screen by roughly 9 percent. Those findings align with separate observations collected across European markets where similar metrics were logged through browser extension panels.
Regional and Platform Variations Observed Through 2026
August 2026 brought updated reporting from several promotional networks operating in Australia and Canada. These reports documented how Safari's Intelligent Tracking Prevention features interact with performance budgets on giveaway sites, sometimes stripping third-party scripts that handle real-time eligibility checks. The resulting delays shifted participation curves downward for users on iOS 19 devices compared with earlier firmware versions.
Desktop environments running Firefox with strict content blocking extensions displayed different signatures. JavaScript execution times lengthened when ad and analytics domains were restricted, yet overall entry completion remained stable because fewer background processes competed for CPU cycles. Industry reports from the Interactive Advertising Bureau note that these trade-offs appear consistently in cross-device comparisons conducted throughout the first half of 2026.
Device age and operating system version add another layer. Participants using Windows 10 machines with integrated graphics show steeper performance decay during peak evening hours when contest refresh cycles coincide with higher network congestion. In contrast, users on recent macOS builds maintain steadier metrics even under similar load, leading to higher recorded submission volumes per active session.
Conclusion
Browser performance metrics supply quantifiable signals that organizers and platform operators use to anticipate participation levels in digital prize events. Load timing, rendering efficiency, memory profiles, and frame stability each map onto measurable differences in entry completion across varied user bases and device classes. Continued collection of these indicators through 2026 supports refinements in site optimization that align technical delivery with user behavior patterns recorded in live campaigns.